Guide to Kindergarten Readiness Dashboard
Subgroups
We used machine learning to identify distinct profiles of initial FAST score and growth (slope) with respect to child, family, and attendance factors that influence a child's early development.
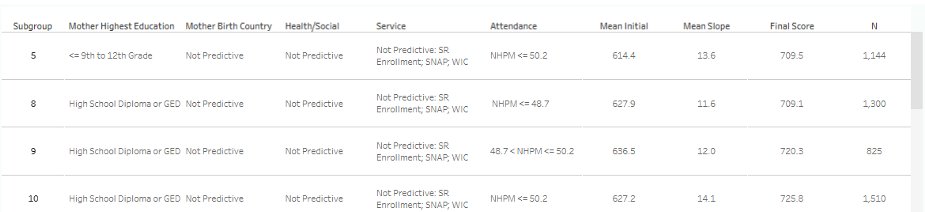
Subgroup is the numeric code for a distinct set of children identified using our methodology.
Mother Highest Education and Birth Country, Health/Social, Service, & Attendance information defines the subgroup: children with specific values for these characteristics constitute the subgroup.
- Not Predictive characteristics did not differentiate children in this subgroup on FAST score and growth
Mean Initial FAST score, Mean Slope (FAST score / month in VPK), and projected Final Score* for the subgroup; also in bubble and bar plots
Subgroup size (within coalition, if selected) given by N
*projected final scores assume 60 hours in VPK per month for 7 months

Dashboard Interface
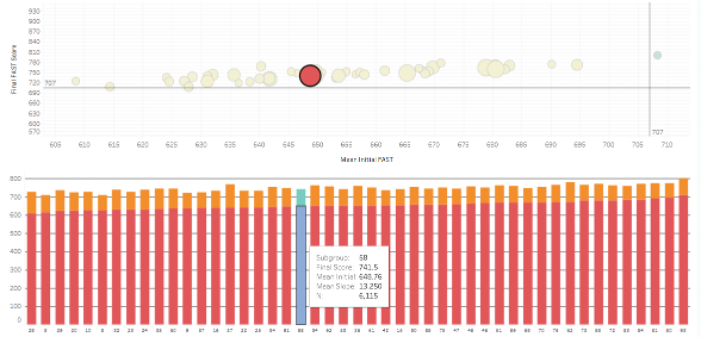
Subgroup Initial and Projected* Final Scores (bubbles)
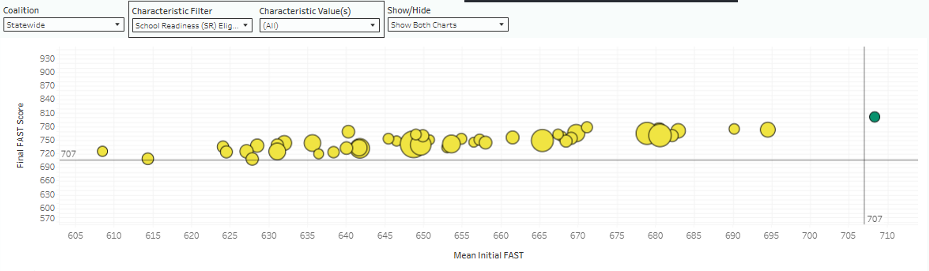
*projected final scores assume 60 hours in VPK per month for 7 months
Subgroup Initial and Projected* Final Scores (bars)
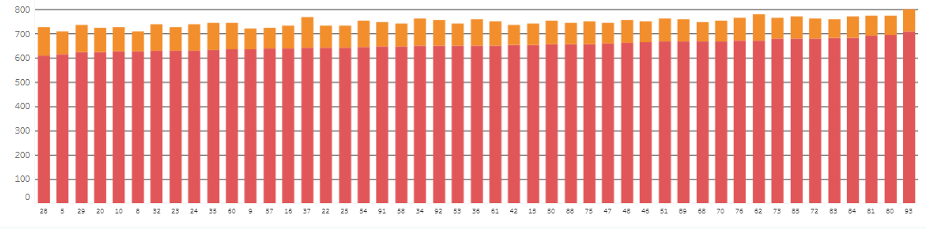
*projected final scores assume 60 hours in VPK per month for 7 months
Detailed Subgroup Information
*projected final scores assume 60 hours in VPK per month for 7 months
How to Use the Dashboard
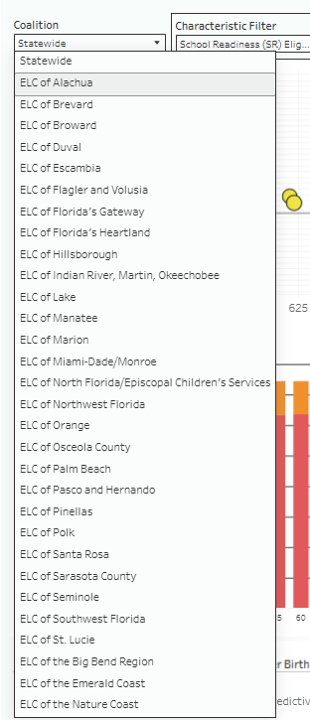
Select a coalition from the dropdown menu to explore subgroups within that coalition
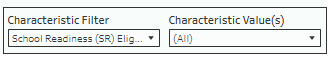
Filter to view only subgroups reflecting specific child/family/provider characteristics
Select a subgroup by clicking a bubble or bar to explore the subgroup (within a coalition, if selected) in greater detail. Show/Hide graphs with the toggle.
Hover on the graph for details
After Selecting a Subgroup: Statistical Results
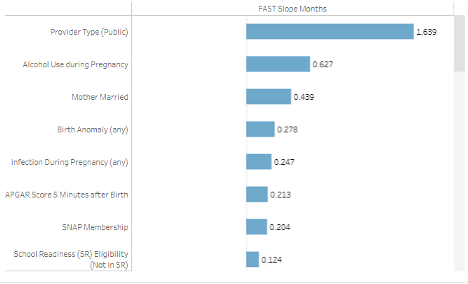
Shapley Values:
Within-subgroup relationships between growth (FAST Slope in Months) and child, caregiver, and provider characteristics with sufficient data
Values below represent the expected increase (positive) or decrease (negative) in FAST slope associated with each predictor for the selected terminal node. For categorical predictors, values represent expected change due to membership in that group. For continuous predictors, values represent expected change for one-unit increase in that predictor. Values were only computed for predictors with sufficient variability within this subgroup.
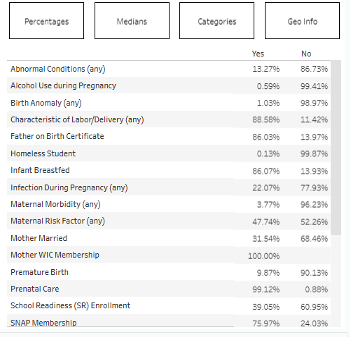
Characteristics of the subgroup:
Press buttons to show Percentages, Medians, Categories, and Geo Info
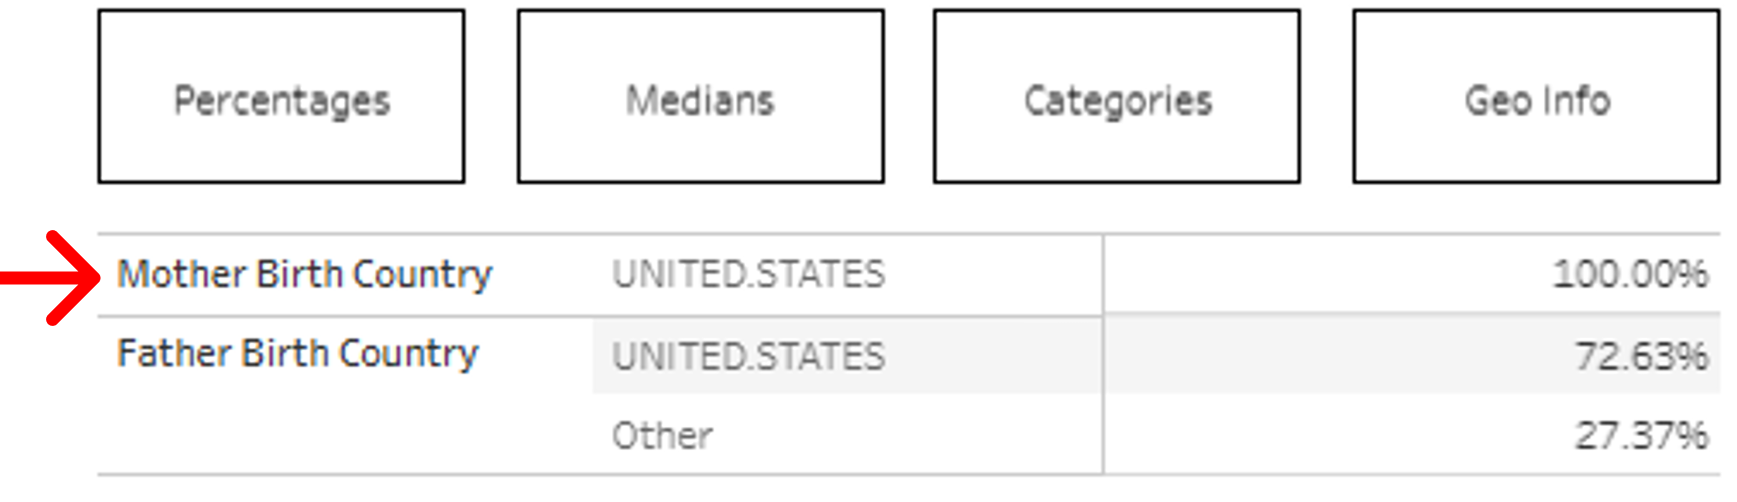
Geographic Information
Initial view shows mother and father birth country summary information.
This subgroup was defined by US-born mothers
Click for maps
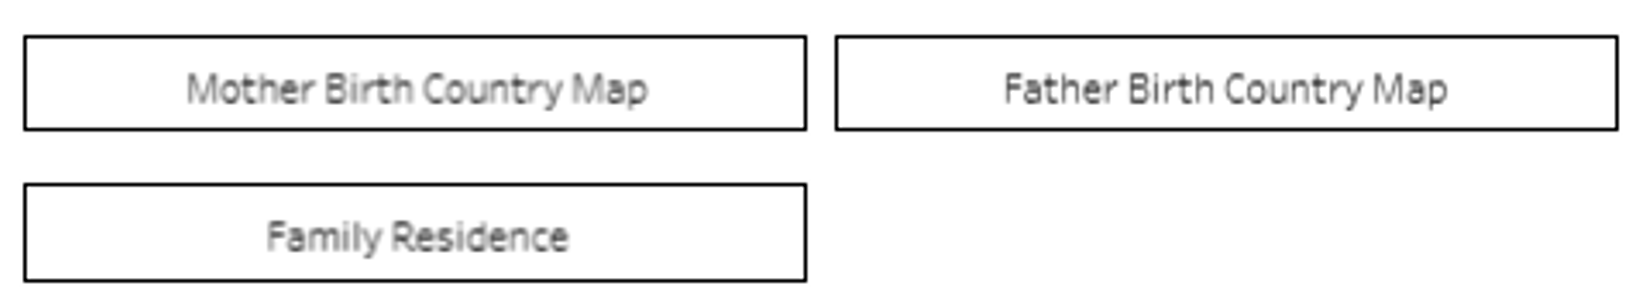
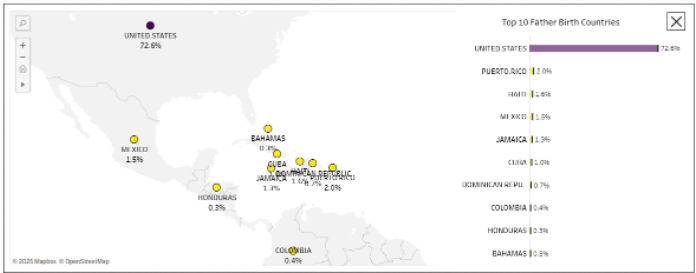
Parent Birth Country Maps
Parent Birth Country Maps
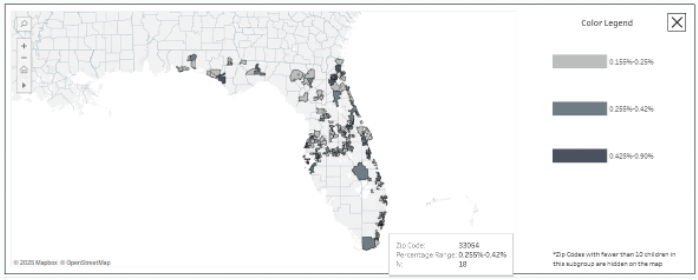
Residence ZIP Code Map
Left-hand Navbar
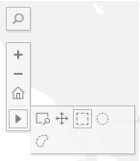
Default navigation: scroll to zoom, CTRL+click-and-drag (Windows) or Command+click-and-drag (Mac) to move around
OR change the controls in the left-hand navbar
Hover over a ZIP code to see its number and how many children from the selected subgroup reside in that zip code.