

Childcare Access
Research that includes interactive maps and analyses depicting access to high-quality childcare options for families participating in Florida’s state childcare subsidy program across different localities.
construction
Tools
- The Florida Index of Preschool Access
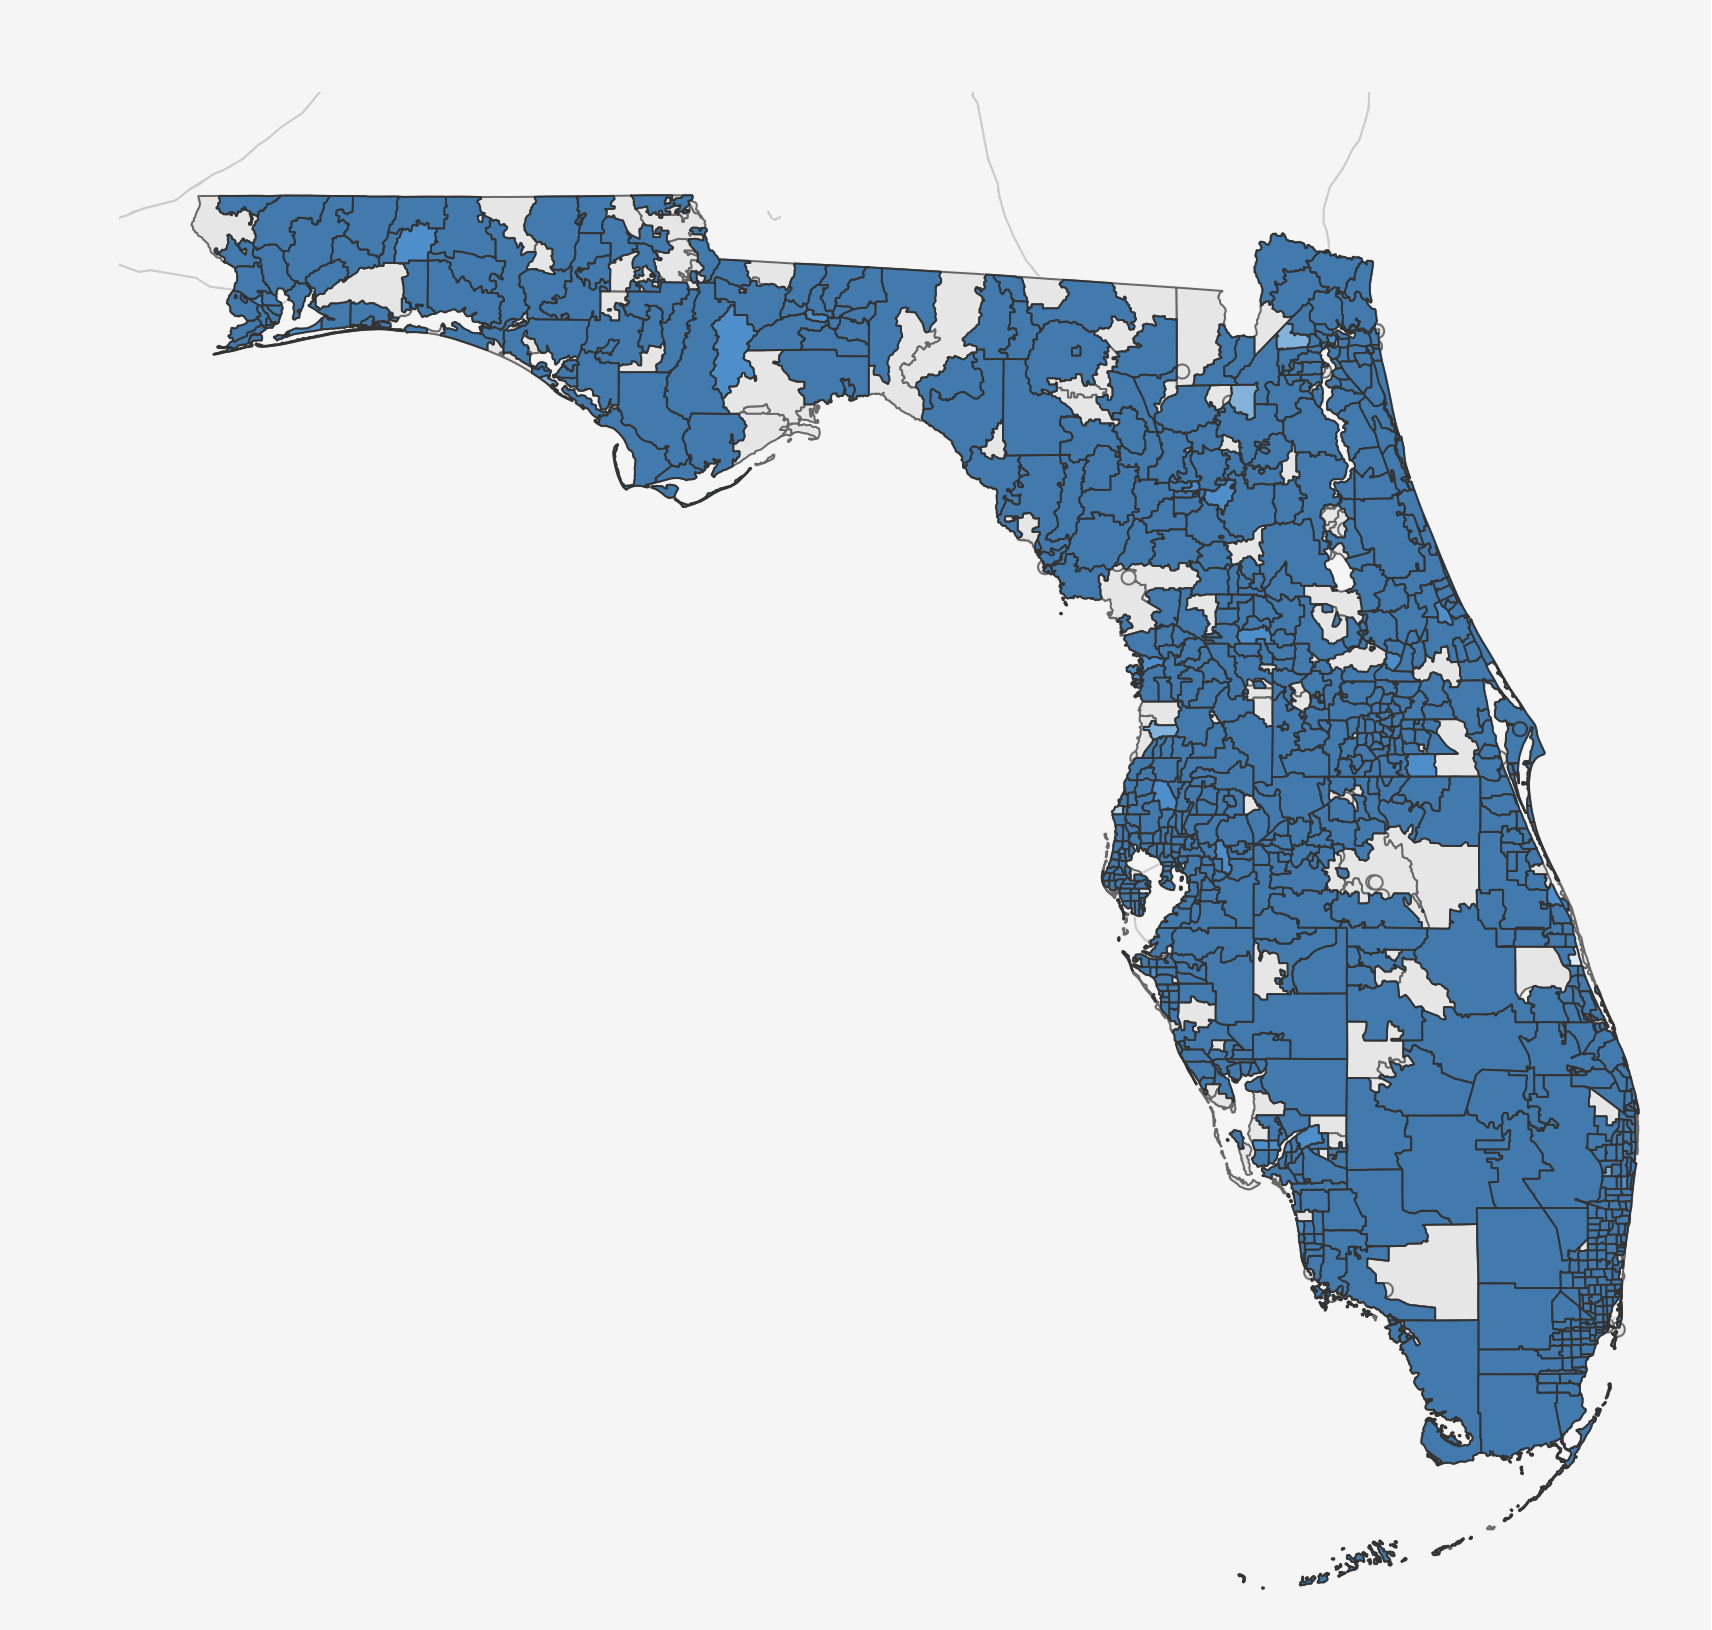
The Florida Index of Preschool Access (FLIPA 2.0.1) is an interactive mapping tool which depicts levels of access to quality child care for families enrolled in the Florida Voluntary Prekindergarten Education Program (VPK).
- The Florida Index of Child Care Access
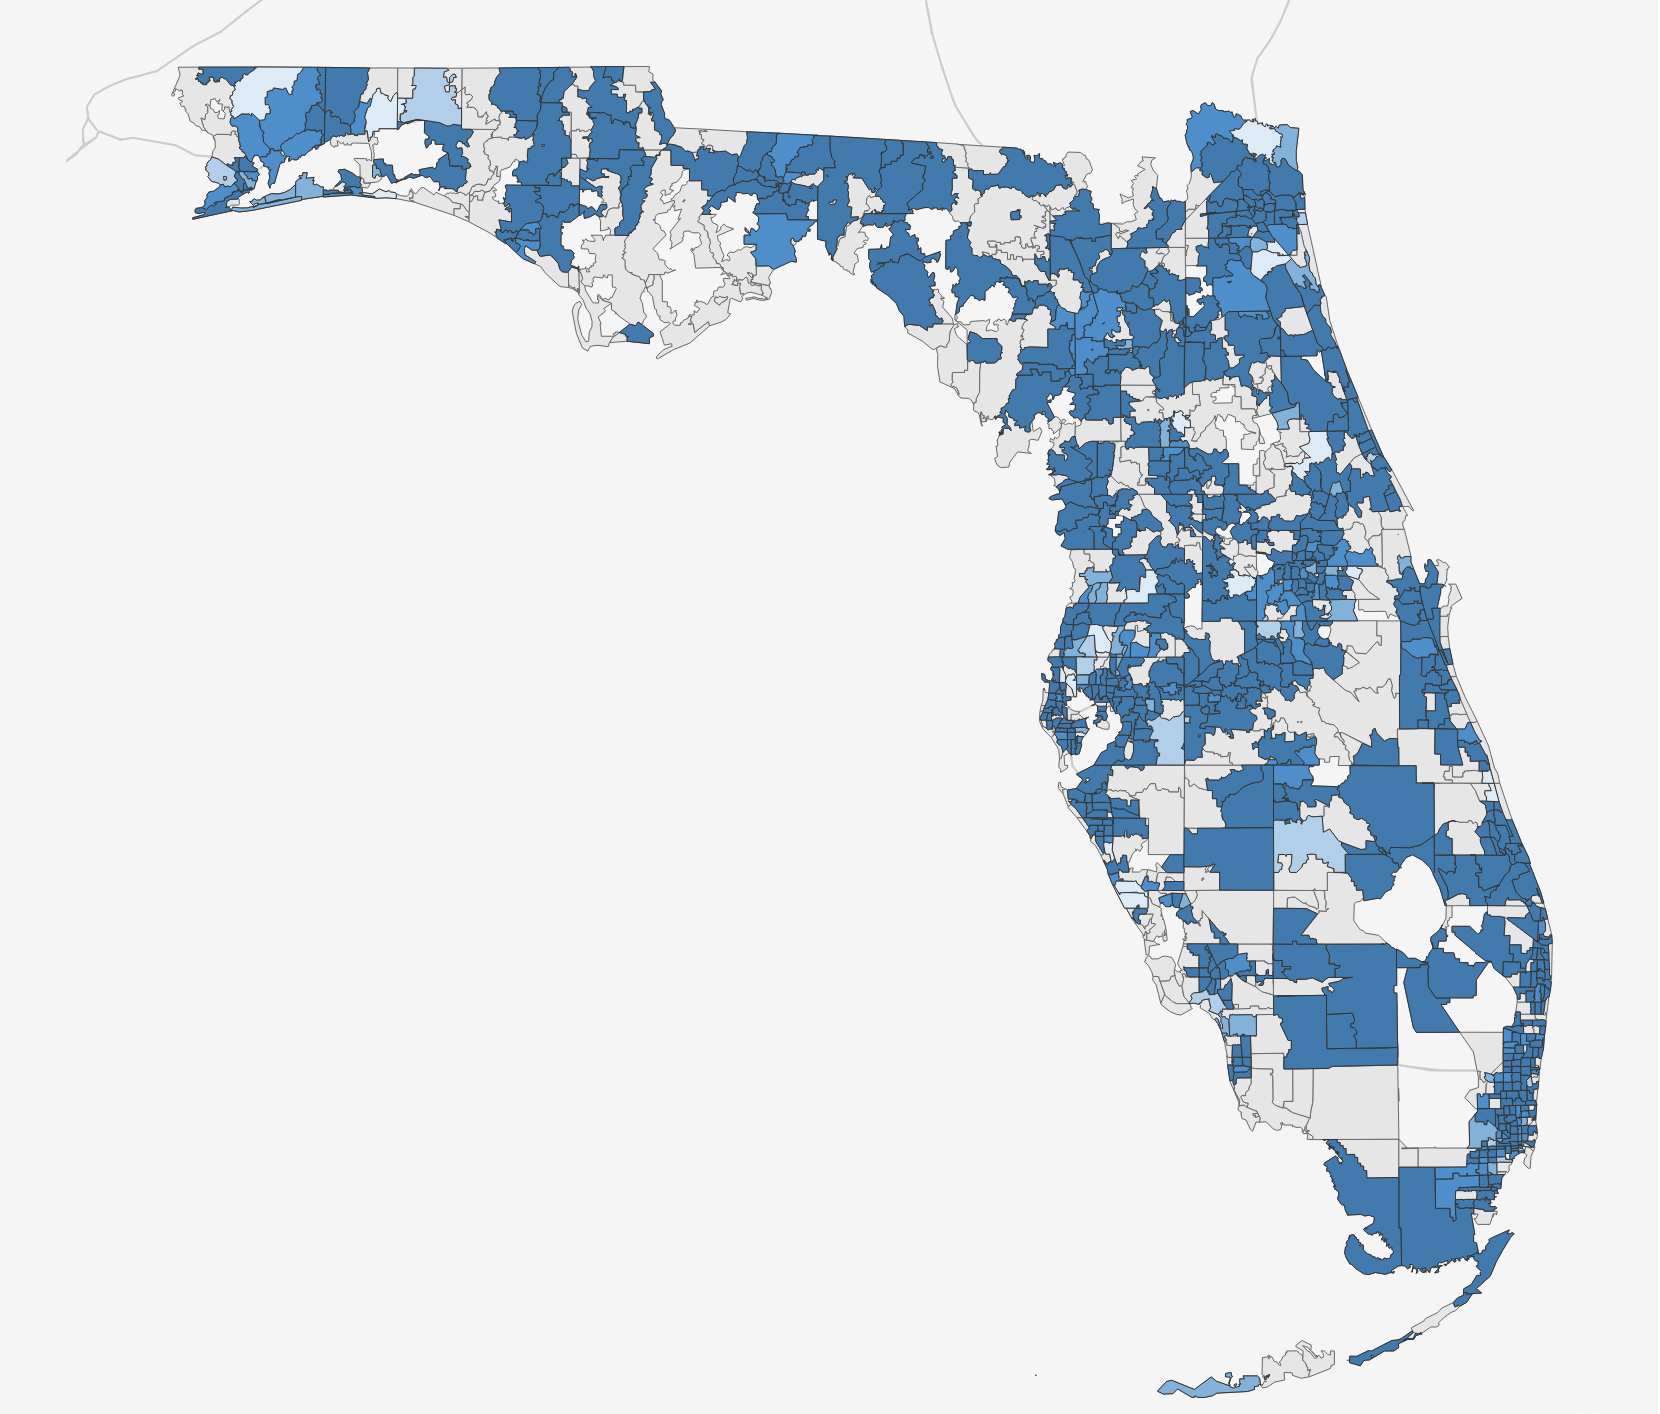
The Florida Index of Child Care Access (FLICCA 5.2.1) is an interactive mapping tool which depicts levels of access to quality child care for families enrolled in the Florida School Readiness (SR) Subsidy Program.
description
Briefs & Reports
- Research Brief: Child Care Affordability for Florida SR Families
Jing Huang, Ph.D., Phillip R. Sherlock, Ph.D., Herman T. Knopf, Ph.D. - Understanding the Determinants of Parent Enrollment in Florida’s Voluntary Prekindergarten Education Program
The Early Childhood Policy Research Group (ECPRG) - Examining the Associations Between School Readiness Providers’ CLASS Scores and Gold Seal Accreditation
Jing Huang, M.S., Phillip R. Sherlock, Ph.D., Herman T. Knopf, Ph.D. - Child Care Provider Survival Analysis
Phillip R. Sherlock, Ph.D., Herman T. Knopf, Ph.D., Robert Chapman, Maya Schreiber, M.A., Courtney K. Blackwell, Ph.D. - Florida School Readiness Households Using Multiple Services
Phillip R. Sherlock, Ph.D., Herman T. Knopf, Ph.D., Jing Huang, M.S., Maya Schreiber, M.A. - Describing Florida School Readiness Service Use Among “At-Risk” Children
Robert Chapman, Herman T. Knopf, Ph.D., Phillip R. Sherlock, Ph.D., Maya Schreiber, M.A., Courtney K. Blackwell, Ph.D. - The Florida School Readiness Program’s Utilization of Child Care Capacity
Herman T. Knopf, Ph.D., Phillip R. Sherlock, Ph.D., Maya Schreiber, M.A., Remy Pages, Ph.D.
construction
Archived Tools
- Measuring Child Care Affordability: Household Percentage Income (HPI)

This analysis originally included interactive maps displaying the county-level Household Percentage of Income (HPI) index across different household sizes. The HPI represents the cost of childcare relative to household income, assessing childcare affordability for Florida’s School Readiness (SR) families. These visualizations compared the current HPI, based on reimbursement rates during the 2022–2023 fiscal year, with a predicted HPI calculated using new rates approved in 2024 to explore the potential impact of updated county rates on childcare affordability. Findings and key insights from these analyses are now available in the Research Brief: Child Care Affordability for Florida SR Families.
- Florida Childcare Provider Occupancy
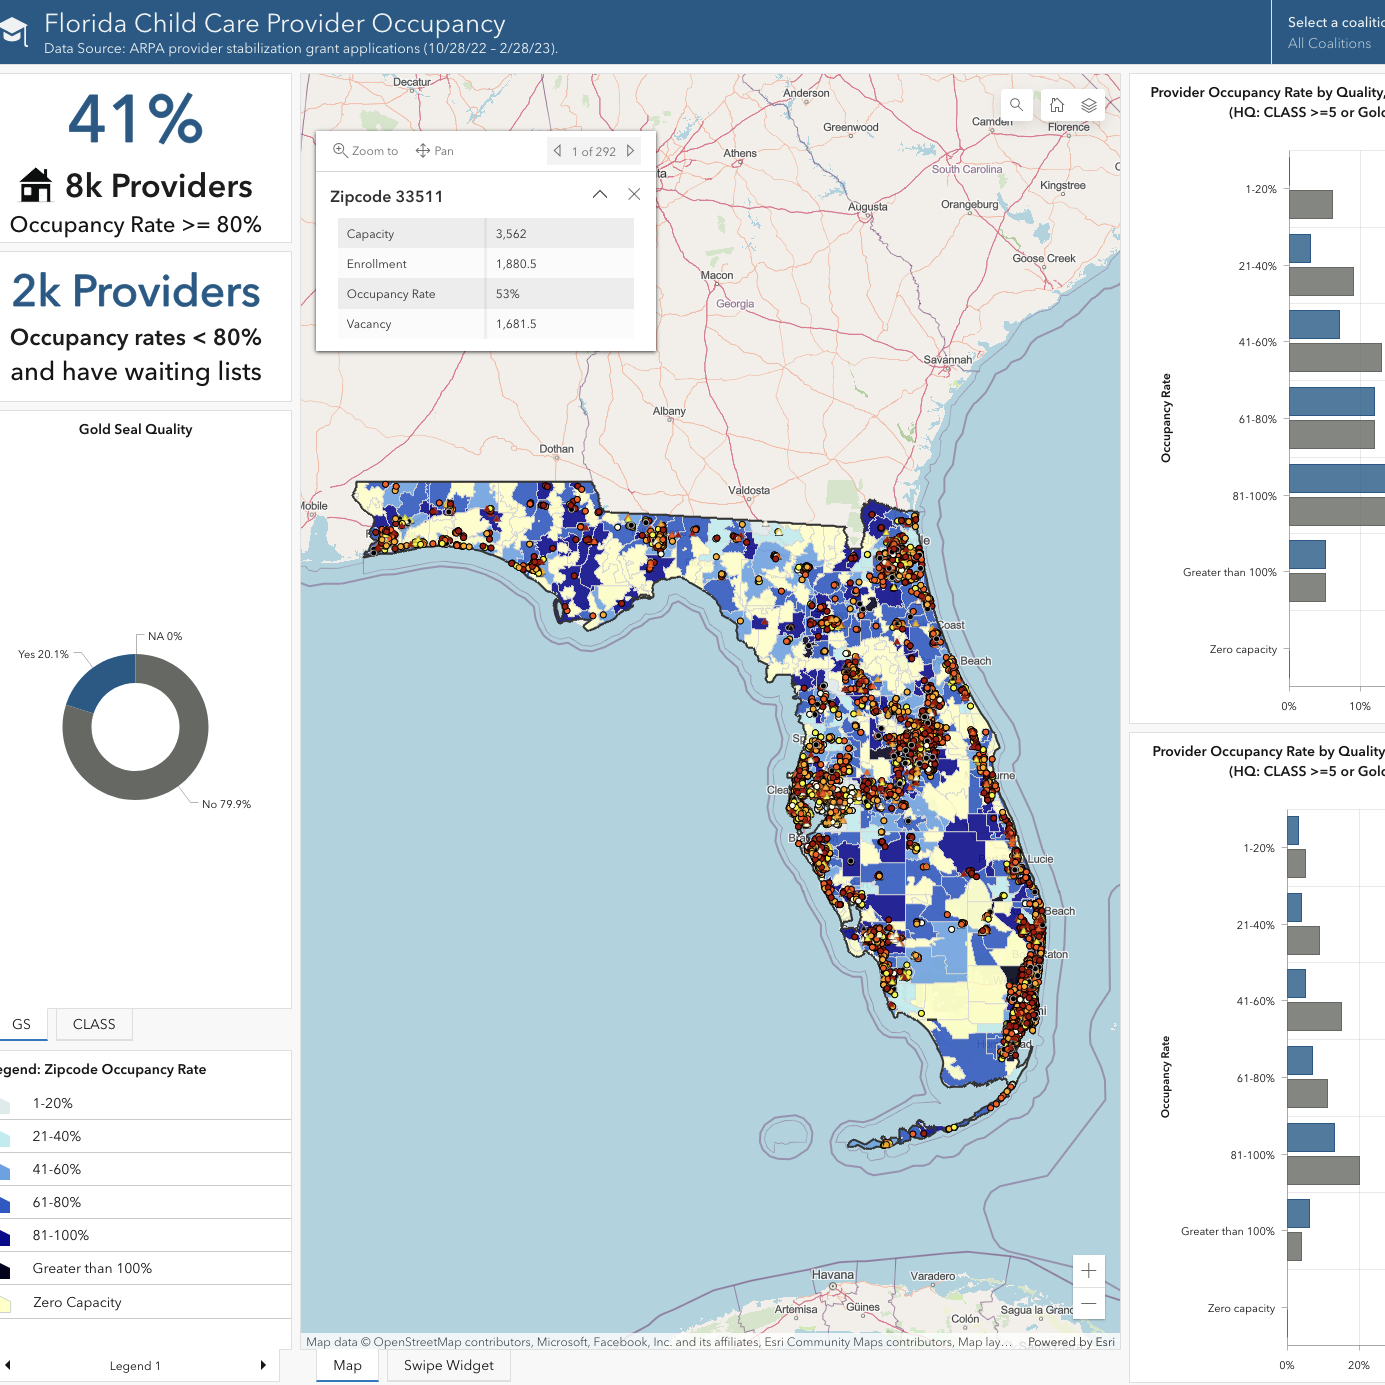
This analysis originally included an interactive visualization displaying provider-level data on childcare capacity and occupancy across Florida, using data from the Florida Division of Early Learning (DEL) American Rescue Plan Act (ARPA) stabilization grant applications.
These visualizations allowed users to explore patterns in occupancy and demand, including identifying providers reporting both low occupancy rates and active waiting lists. While the interactive visualization is no longer available, key findings and interpretations from these analyses are now available in the Research Brief: Child Care Provider Survival Analysis.
Key considerations when interpreting these findings include:
- Occupancy rates greater than 100% may reflect providers serving children in shifts or potential data entry inconsistencies.
- Providers reporting occupancy rates below 80% while also maintaining waiting lists suggest that lower utilization may not always be driven by limited demand.